
Disclaimer: This research should be used purely for informational purposes and is my own personal opinion. I bear no responsibility to whatever investment decisions taken by anyone with regards to this research.
It has been approximately one month since I began coverage on the stocks I am keeping track of with investment calls. I figure now will be a good time to review the performance of these stocks, to examine any learning opportunities from them. There are basically 2 learning points namely:-
- Overall portfolio of stocks has generally outperformed the overall KLCI market, but is riskier.
- Manufacturing-related companies were the main drivers to the portfolio growth, and presents an interesting investing strategy in terms of sector composition. The sectors of Technology, Telecommunications and Media, Utilities and Construction seemed attractive to buy during a decline as they tend to be oversold, and subsequently experiences higher rates of rebound.
Overall portfolio of stocks has generally outperformed the overall KLCI market, but is riskier
My stocks portfolio’s returns were generally higher than the performance of the KLCI market by about 3.7% from 7 Apr 2020 until now. KLCI returns averaged around 0.6%, while my portfolio averaged around 4.3%. So does that mean my portfolio has superior returns? Not exactly, we are always constrained by the inevitable investment principle of the higher the return, the higher the risk. This is no exception. My portfolio has a standard deviation (risk) of about 2.1%, while the KLCI’s risk is much lower at 1.2%. This results in a portfolio beta of 1.6, which means my portfolio is riskier in terms of its profile compared to the overall market. (Note: Portfolio beta measures the volatility of a stock against the overall market. The higher it is, the riskier it is)

But it doesn’t always mean the higher the return, the higher the risk. We can evaluate whether we are maximising our returns with the risk profile we are taking. Case in point, if we examine the 95% confidence interval of both the KLCI and portfolio at this point in time, investing in the portfolio has yielded a better investment decision.
The 95% CI for the KLCI stands at a range of 0.0% to 1.2%, while the portfolio stands at 3.2% to 5.3%. This means we are 95% confident that the average return will fall between 3.2% to 5.3%, much higher than 0.0% to 1.2% in the KLCI.

Manufacturing-related companies were the main drivers to the portfolio growth, and presents an interesting investing strategy in terms of sector composition. The sectors of Technology, Telecommunications and Media, Utilities and Construction seemed attractive to buy during a decline as they tend to be oversold, and subsequently experiences higher rates of rebound.
Four companies in my portfolio registered double digit growth in share price, namely Lotte Chemical Titan (+30.5%), Padini Holdings (+17.2%), Bermaz Auto (+15.5%) and Cahya Mata Sarawak (+12.5%). Three of them (Lotte, Bermaz Auto, and Cahya Mata Sarawak) are involved in manufacturing-related production or services, and I liked them because of their low price earnings ratio, steady historical track record and dominant market positions. Utilising data from Bursa’s classification of sectors in the market, the manufacturing sector tends to be oversold more when compared to the other sectors (financial services, consumer products and services, and REIT), which leads to a stronger rebound from the decline in 19 Mar 2020 when the MCO was imposed. (Note: The portfolio of stocks I am keeping track of falls under the 4 sectors mentioned above)
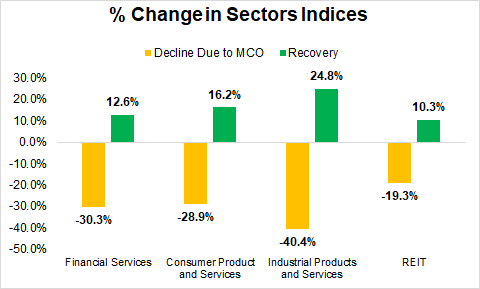
This actually opens up some interesting investing strategies for a sector-based approach. We could examine the rate of the rebound to the decline of the various Bursa sectors and determine which sectors actually have the highest rates of rebound. This could help us in our strategy to determine which sectors tend to be oversold during periods of decline and shocks. A bit of information on how I am going to compute the magnitude of rebound, is to take the ratio of the rebound’s growth rate over the decline due to MCO’s growth rate. For example, for Industrial Products and Services, I will take 24.8% and divide by 40.4% to get a ratio of 0.61x.

From the analysis above, the Technology (1.29x), Telecommunications and Media (0.94x), Utilities (0.85x) and Construction (0.75x) sectors seemed to have high rebound rates from a decline. While I can’t conclusively say that these sectors have high rebound rates (due to other factors in play) from a decline, but from a technical point of view, they do provide support to buying during periods of decline for higher potential share prices appreciation.
All charts data are from Yahoo Finance, Rakutentrade, and Bursa Malaysia
