
I am sure many of us have wondered how to research on investing in companies. I have prepared this guide for any of you who is interested in getting your feet into the market and hopefully make it accessible to understand how to invest in a company. I am deeply grateful that my past experiences has provided me with a base to conduct my research and I would like to detail how I make my investment decisions. Hopefully this will serve you all well. Without further ado, let’s get on with it.
Explain in Simple Terms what the Company does. If you can’t, Move On.
This is perhaps the most important thing when we start researching on a company. If we just look at the financials of a company without knowing what they do or what they are about, we are practically gambling if we invest in it. I am a firm believer of investing in companies that have a straightforward and easy-to-understand business model. Buy what you understand.
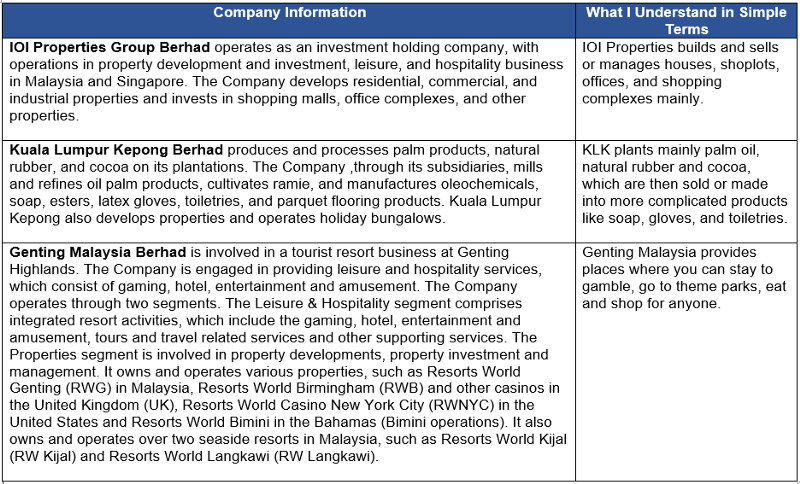
For starters, I like to go to any of the investing websites such as Bloomberg, Wall Street Journal and Yahoo Finance to just read the summary of the companies I am interested in investing in. What I will then do is imagine in my mind how the company generates its revenue. For some of the companies I have looked at in the past, the company information below details how I try to explain to someone in simple terms what the company does.
The next step I would take after understanding what the company does is to deep dive into the annual report of the company. For this part, I will usually go through the section on Management Discussion and Analysis, as the section will discuss the following items that are important:-
- Operational Performance: This will detail the operational metrics that are important to the company. For example, for a property company, their success will be dependent on the sales rate (Unit sold divided by Unit Launched) of their properties. For a palm oil company, the fresh fruit bunch production yield is important to measure how efficient is the company in harvesting its produces.
- Segmental Analysis: This is essentially how the company’s revenue is divided whether through its business units or geographical coverage. For example, when I analyzed Genting Malaysia, I was positive on the company as it was on the path towards increasing the contribution of its non-gambling business segment ( retail, hotels, theme parks, etc) to revenue, as it seeks to increase the amount of time and money spent by its visitors.
- Company Outlook: This is a great way to know what the company thinks of its prospects moving forward. Oftentimes, they will talk about the operating environment they are under and detail the risks they are facing.
Investigate the Market and Environment the Company is In
The way to think about this is essentially to think about the bigger picture for the company. What drives the company’s revenue and prospects. What kind of event will boost or reduce their revenue. What data or indicator will inform the market condition and prospect.
For example, for a company like Kuala Lumpur Kepong whom mainly plants and sells palm oil, they are mainly used to produce consumer goods like soap, toiletries. I needed to understand that Malaysia exports most of the palm oil to overseas and thus are highly dependent on global demand for them. Hence, I conducted a market analysis where I investigated the projected GDP growth rates of Malaysia’s main palm oil exporters in Southeast Asia, India, China, United States and the European Union in 2018.


The demand and supply for palm oil will then impact the Crude Palm Oil (CPO) price, which directly impacts the profit margins of Kuala Lumpur Kepong. When CPO prices declined after 2014, Kuala Lumpur Kepong’s net profit margin also declined reflecting lower selling prices for CPO.


Have an In-depth look into the Company’s Financial Performance and Compare it to the Competition
This is easier said than done. I do understand it’s really not easy to examine a company’s financials unless you come from a finance/business related background. And even then, the numbers might not make sense. For me, there are 2 main things I look at in coming to a good view on the company, namely:-
- Revenue Growth: How do we know whether a company is growing at the “right” speed? There is a hard and fast rule for this, any revenue growth over the past 5 years that are above 3% and below 6% is considered as normal growth. Growth that is higher than 6% can be considered as strong. My reasoning for this is that companies need to grow above 3% to mitigate inflation that is about 2–3% historically. I do also take into account what kind of company it is. I expect 3–6% growth for companies that are old or are in traditional sectors like banking, energy, and commodities. For tech companies, I expect growth that is above 10% (or in some instances 20%) because they crash and burn much quicker and have a small timeframe to capture market shares.
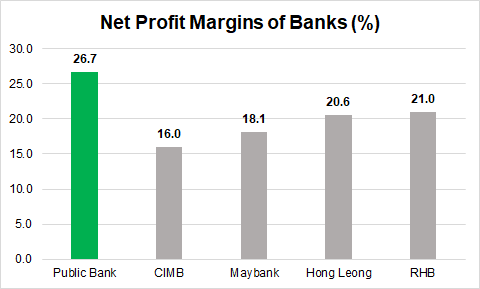
- Net Profit Margin: There is sort of an art to seeing whether net profit margins are healthy. I am always guided that an increasing net profit margin is always best, since it means that the company is getting more and more efficient at generating profit. However, how high should the margin be? How low is bad? Its obvious that if the company is making losses, that’s bad but a company that has lower profit margins are not necessarily worse off than one with higher margins. Nestle Malaysia for example, has a net profit margin of 12.1%, lower than Public Bank’s net profit of 26.7%. Does that mean Public Bank is a better company? No, because they are in different industries with different cost structures. What I do is compare Public Bank’s net profit margin to other banks to get a fair picture of its position in the market. For your information, Public Bank has one of the highest profit margins in the banking industry.
Value the Company to see whether its a Buying Opportunity
There are many ways of valuing a company such as Discounted Cash Flow, Price to Revenue, Price to Earnings, Enterpise Value to Earnings Before Interest, Tax, Depreciation and Amortization, and many others. I myself primarily use Discounted Cash Flow and Price to Earnings ratio to value a company. However, for the sake of making it easier for people to understand and apply a valuation methodology, I recommend using the price to earnings ratio methodology. It is simple and only require very few data. If you go to any investing website, you will come across the following information on the company overview page.
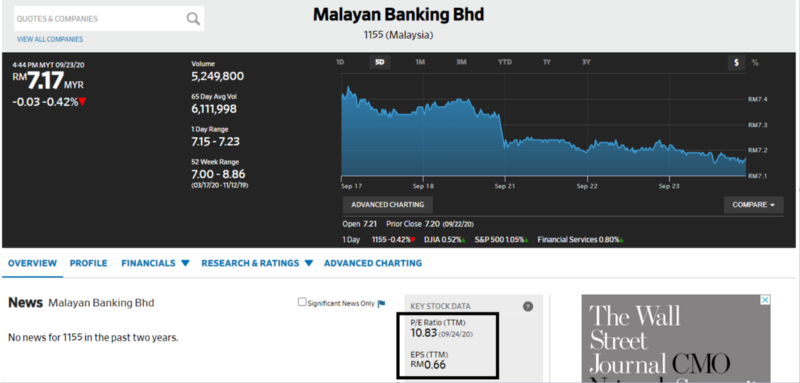
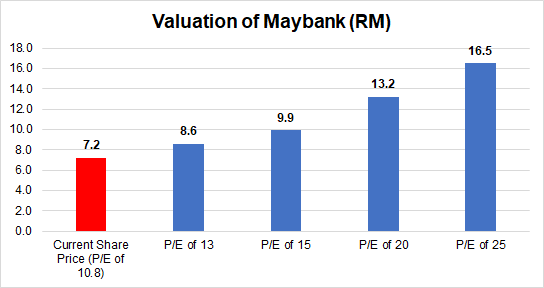
Pay attention to the box in black, you only need these information to make a valuation. In basic terms, a Price Earnings ratio is the measure of how high the share price is trading to the current earnings per share. 10.8x means the share price is trading 10.8 times higher than the annual profit per share for that company. Mathematically, Share Price/Earnings Per Share = Price Earnings Ratio or in Maybank’s case, RM7.17/ RM0.66 = 10.83x. For me, I always have a benchmark on how to value according to this. From my experience, 15.0x is the normal price earnings ratio Malaysian companies trade at, 20.0x when I think the company has a decent prospect moving forward and 25.0x when I am fully bullish on the company’s prospects. For the banking sector, I do know historically that they trade around 12x to 13x as they are viewed as a steady normal industry. The higher the price earnings ratio you assume for the company, the more bullish you are about the company and vice versa.
Right now, I do feel Maybank does have a potential to trade higher if I believe that investors are undervaluing the banking industry, due to the low interest rates set by the central bank. Even with a conservative estimate of assuming a 13.0x price earnings ratio for Maybank, Maybank has a potential to trade higher by 20% at RM8.5.
The price earnings ratio is a really quick way of valuing a company with only assuming the price earnings ratio they are trading at. Remember, the higher the price earnings ratio you assume, the more you expect the company will grow stronger in the future and vice versa.
And that concludes my investment process for a company, I really hope you have learned a lot of things from this, and if you need any help, feel free to reach out to me on my email hosuwei1992@gmail.com or Facebook of Ho Su Wei.
