
Hello, everyone. I figure this will be a good time to introduce a template for everyone to use to do some financial valuation for the companies that you are interested in. I created this template to be simple to understand and use but admittedly, it does still have a lot of improvements to go. However, I am a firm believer that anyone can do their own financial valuation without breaking the bank to go learn about them. Let me start by detailing how to use the financial valuation template. It is currently set to “Read only”, but you can save the file as a new excel file in your google drive through “Making a Copy” through the “File” section.
Financial Valuation Link: https://docs.google.com/spreadsheets/d/1LvFASDPaGbXdDtQQSdEkEiWcW1193xcVlKVKA9hj8ZQ/edit?usp=sharing
Step 1: Fill in the basic information on share price, earnings per share, price earnings ratio etc
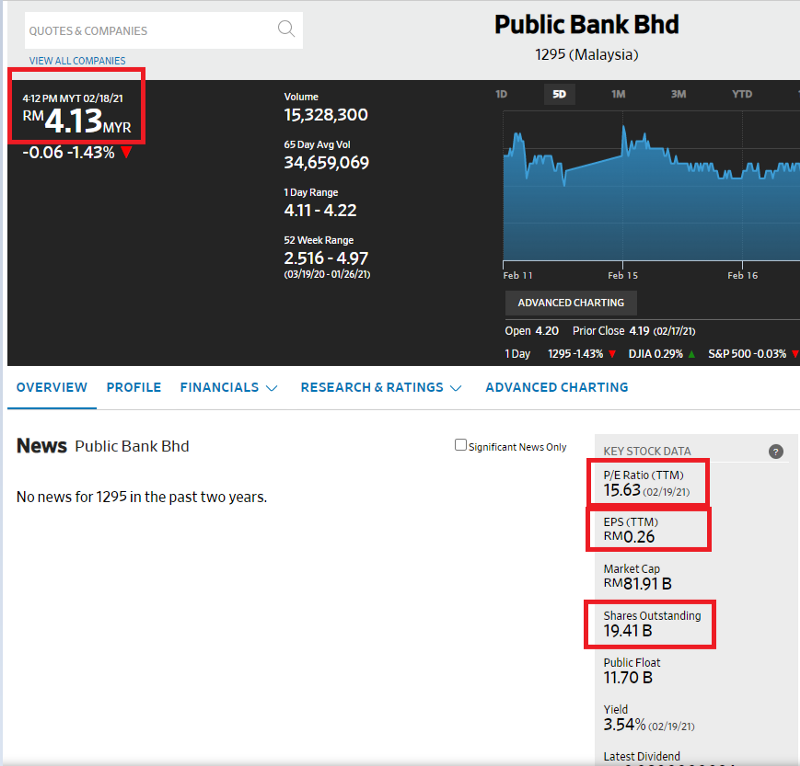
Start by going to any financial websites such as Yahoo Finance, Bloomberg, Wall Street Journal or others, and go to the page called “Summary” or “Overview” for the company that you are looking for. Look for the indicators labelled as current share price, price earnings ratio and earnings per share. Here is an example for Public Bank from Wall Street Journal.
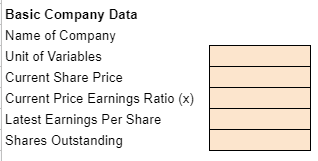
Next, use these details to fill in the boxes that are shaded in orange in the template in Section 2 called “Inputs for Valuation”. Ignore the unit of variables for now, but make sure you fill in the shares outstanding as the whole number. For example, 19.41bn should be 19,410,000,000 for shares outstanding.
Step 2: Fill in the financial information in the box shades after that with details from financial websites.
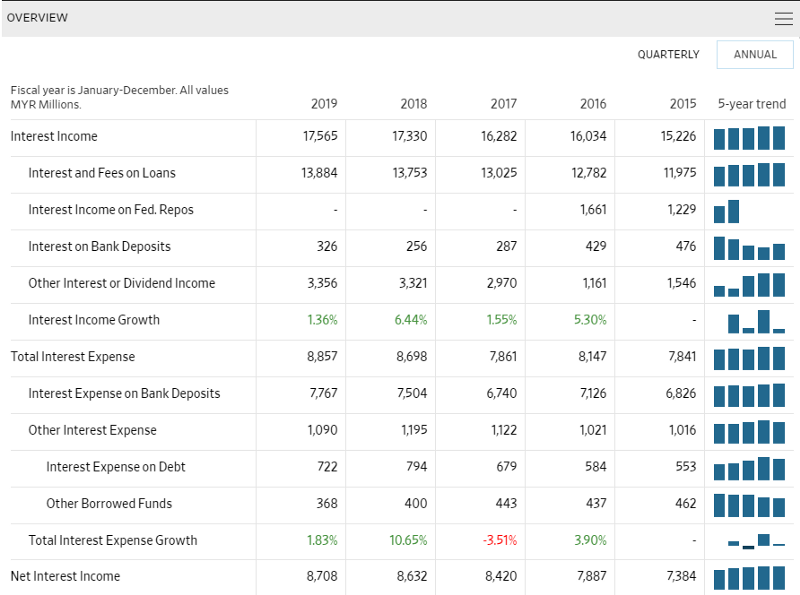
This is not that straightforward, but bear with me. For me, I go to the Wall Street Journal website and go the section called “Financials” and then to “Income Statement”. You will be able to see the past 5 years historical financials of the company. For example, it looks like this for Public Bank.
Fill in the latest year of financial data as “2019” in this case, and copy the data into the shaded orange boxes. You need to be aware about the units that these numbers have. For this case, it is MYR millions, now you can fill in the “Unit of Variables” previously as “1,000,000”.
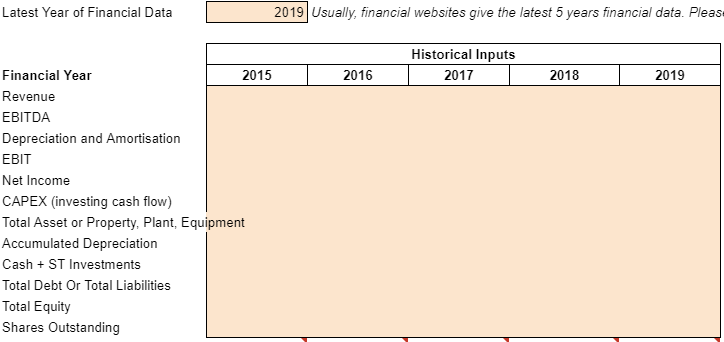
For variables such as Total Asset, Accumulated Depreciation, Cash + ST Investments, Total debt, Total Equity, you would need to go the financial section called “Balance Sheet”. For CAPEX, you need to go to the section called “Cash Flow”. As always, be careful about the units in all these financial sections cause they might be denoted in different units.
Step 3: Forecast the revenue growth rate and EBITDA margin for the company that you are valuing at
The next step is where you can put in your own forecast for revenue growth rates and the EBITDA margin. Don’t worry too much about the EBITDA margin, just use the median or average that was computed automatically when you filled in the data in Step 2.

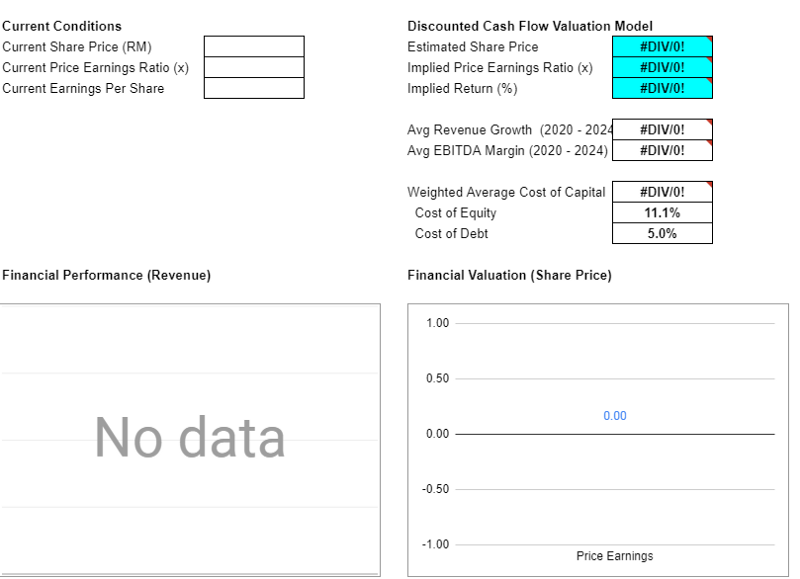
Step 4: Look at the result of the financial valuation in Section 1 now to see whether it makes sense to you
Once you have filled in all the necessary inputs, you can now check on your financial valuation in section 1 under discounted cash flow valuation. See whether it makes sense to you. If it doesn’t, you can then change your “revenue growth” and “EBITDA margin” assumptions.
Conclusion: I hope that you will find this template useful for your own personal use. I didn’t go into detail on how the valuation works cause I think it will just complicate things. But if you are interested, feel free to message me about it.
