
So far, in week 2 currently, there are a couple of technical analysis we can take note of for the start of the second week for the FBM KLCI market. The takeaway from this week is that the market might be down according to the technical indicators.
Bollinger Band is showing that it is starting to widen.
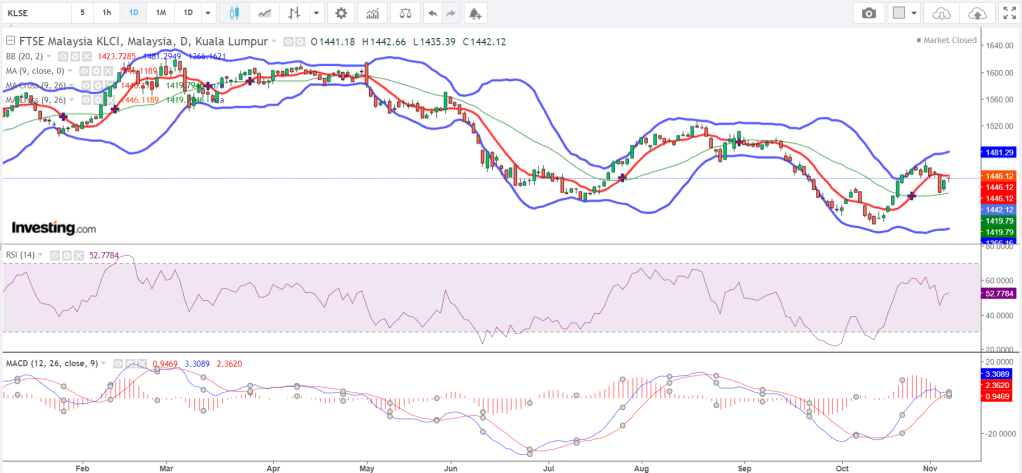
The Bollinger band has started to widen back from the middle of October 2022, after narrowing for a bit before that. It has previously come off from a widening downward trend since the middle of September 2022. The direction of the Bollinger band widening is now on the upward trend. It seems that the band resistance level is at about the 1,530 level with the support level firmly at 1,362 level.
The Moving Average is showing upward trend but could be reversing direction after flattening recently.
The Moving Average (red line) trended upwards since the middle of October 2022, but has recently flattened around the 1,450 level. Judging based on the previous trend between middle of July to October, a flattening of the moving average brought about a downward trend after that hence it is possible the flattening currently could bring about another downward trend.
Relative Strength Index (RSI) has also shown flattening recently at about neutral level.
From the previous upward trend, it does seem that the RSI has settled at a steady level of around neutral around 50. From the previous upcycle, when RSI hit about 60 to 70 levels, it comes back down to very oversold positions of 30. Hence, it does seem likely that the RSI might be trending downwards after this. This presents an interesting position to buy in if that happens.
The MACD indicates that it might be time to go short.
The MACD (blue line) which is currently on top is almost reaching the signal line (red line), potentially triggering a short position to be taken. The recent upward performance of the KLCI brough the MACD line on top of the signal line, pushing many investors into taking up long position in the market. However, the recent convergence of MACD and signal line, could reverse the position of investors in the market towards shorting.
Conclusion: Most technical indicators for the week are indicating a down market and potentially short positions to be taken.
